

|
~
|
 The AROMAPEX campaign The AROMAPEX campaign took place in Berlin in April 2016. The primary objective of AROMAPEX was to test and intercompare the performance of experimental airborne imagers, dedicated to the retrieval and high resolution mapping of tropospheric nitrogen dioxide (NO2). NO2 is an atmospheric trace gas and a key pollutant that deserves considerable attention as it (1) indirectly affects the climate system, (2) is assumed to be a proxy for air pollution in general and (3) can have a direct health impact. NO2 is a short-living species with concentrations that can vary strongly both in space and time. For the reasons stated, the monitoring and accurate mapping of air pollutants at the scale of cities is of high (social) relevance. AROMAPEX is also a preparatory step for forthcoming calibration/validation campaigns for the new generation of satellite air quality sensors, starting with TROPOMI.
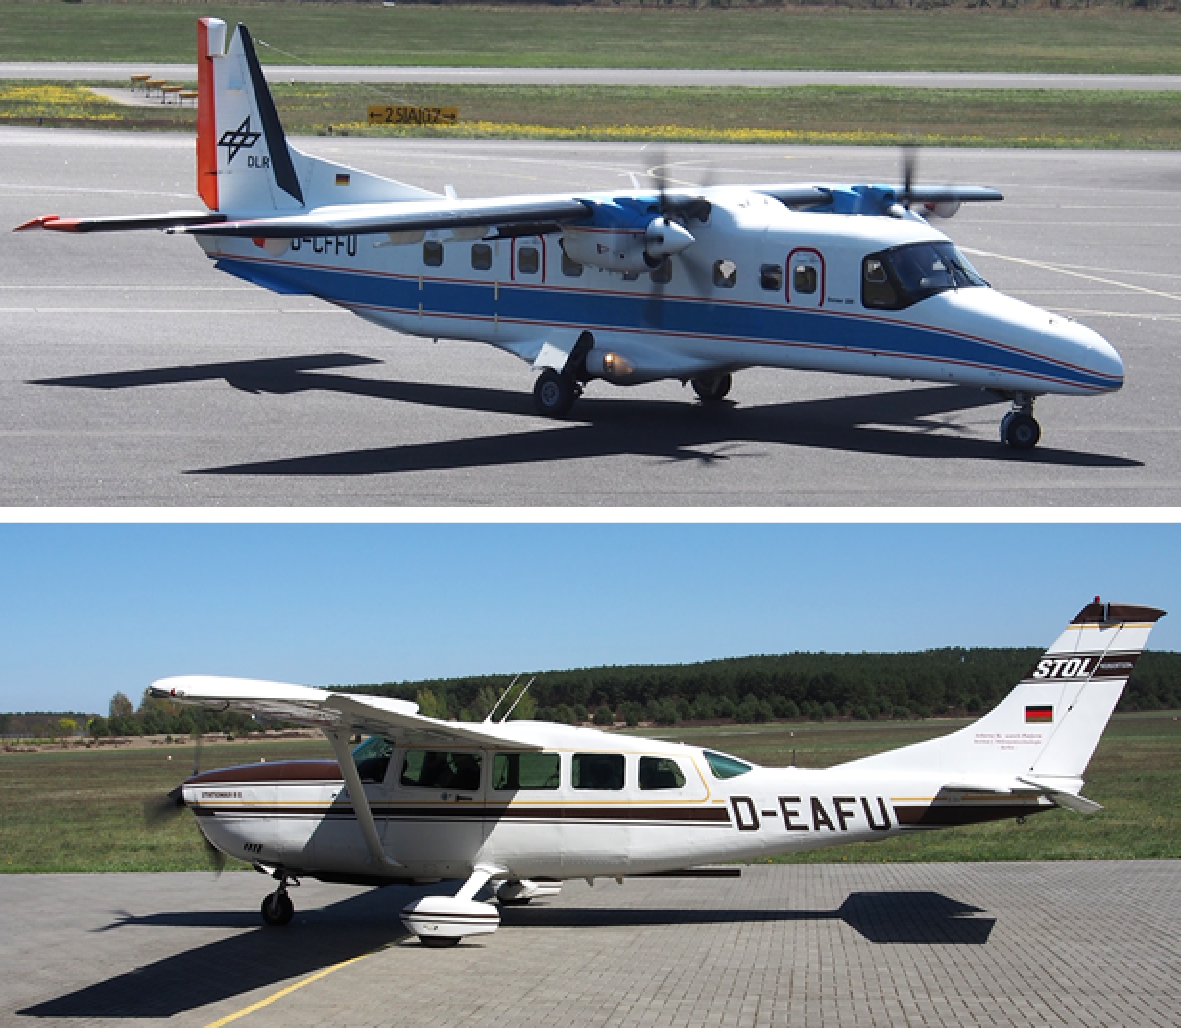
Fig 1. The two aircraft operated simultaneously during the AROMAPEX campaign: the Dornier DO-228 D-CFFU from DLR (top) and the Cessna 207T D-EAFU from FUB (bottom). The imaging DOAS instruments were operated simultaneously from two manned aircraft, performing synchronised flights: APEX (VITO/BIRA-IASB) was operated from DLR’s DO-228 D-CFFU aircraft at 6.2 km altitude while AirMAP (IUP-Bremen), SWING (BIRA-IASB) and SBI (TNO/TU Delft/KNMI) were operated from the FUB Cessna 207T D-EAFU at 3.1 km. Two synchronised flights took place on 21 April 2016, the only cloud-free day during the campaign, in the morning from 09:34 to 12:01 LT and in the afternoon from 14:24 to 16:39 LT. APEX, AirMAP and SWING have a comparable swath width of 3 km, while SBI has a swath of 435 m. The spatial resolution is better than 100 m for APEX, AirMAP and SBI (pushbroom scanning), and approximately 300 m for SWING (whiskbroom scanning).
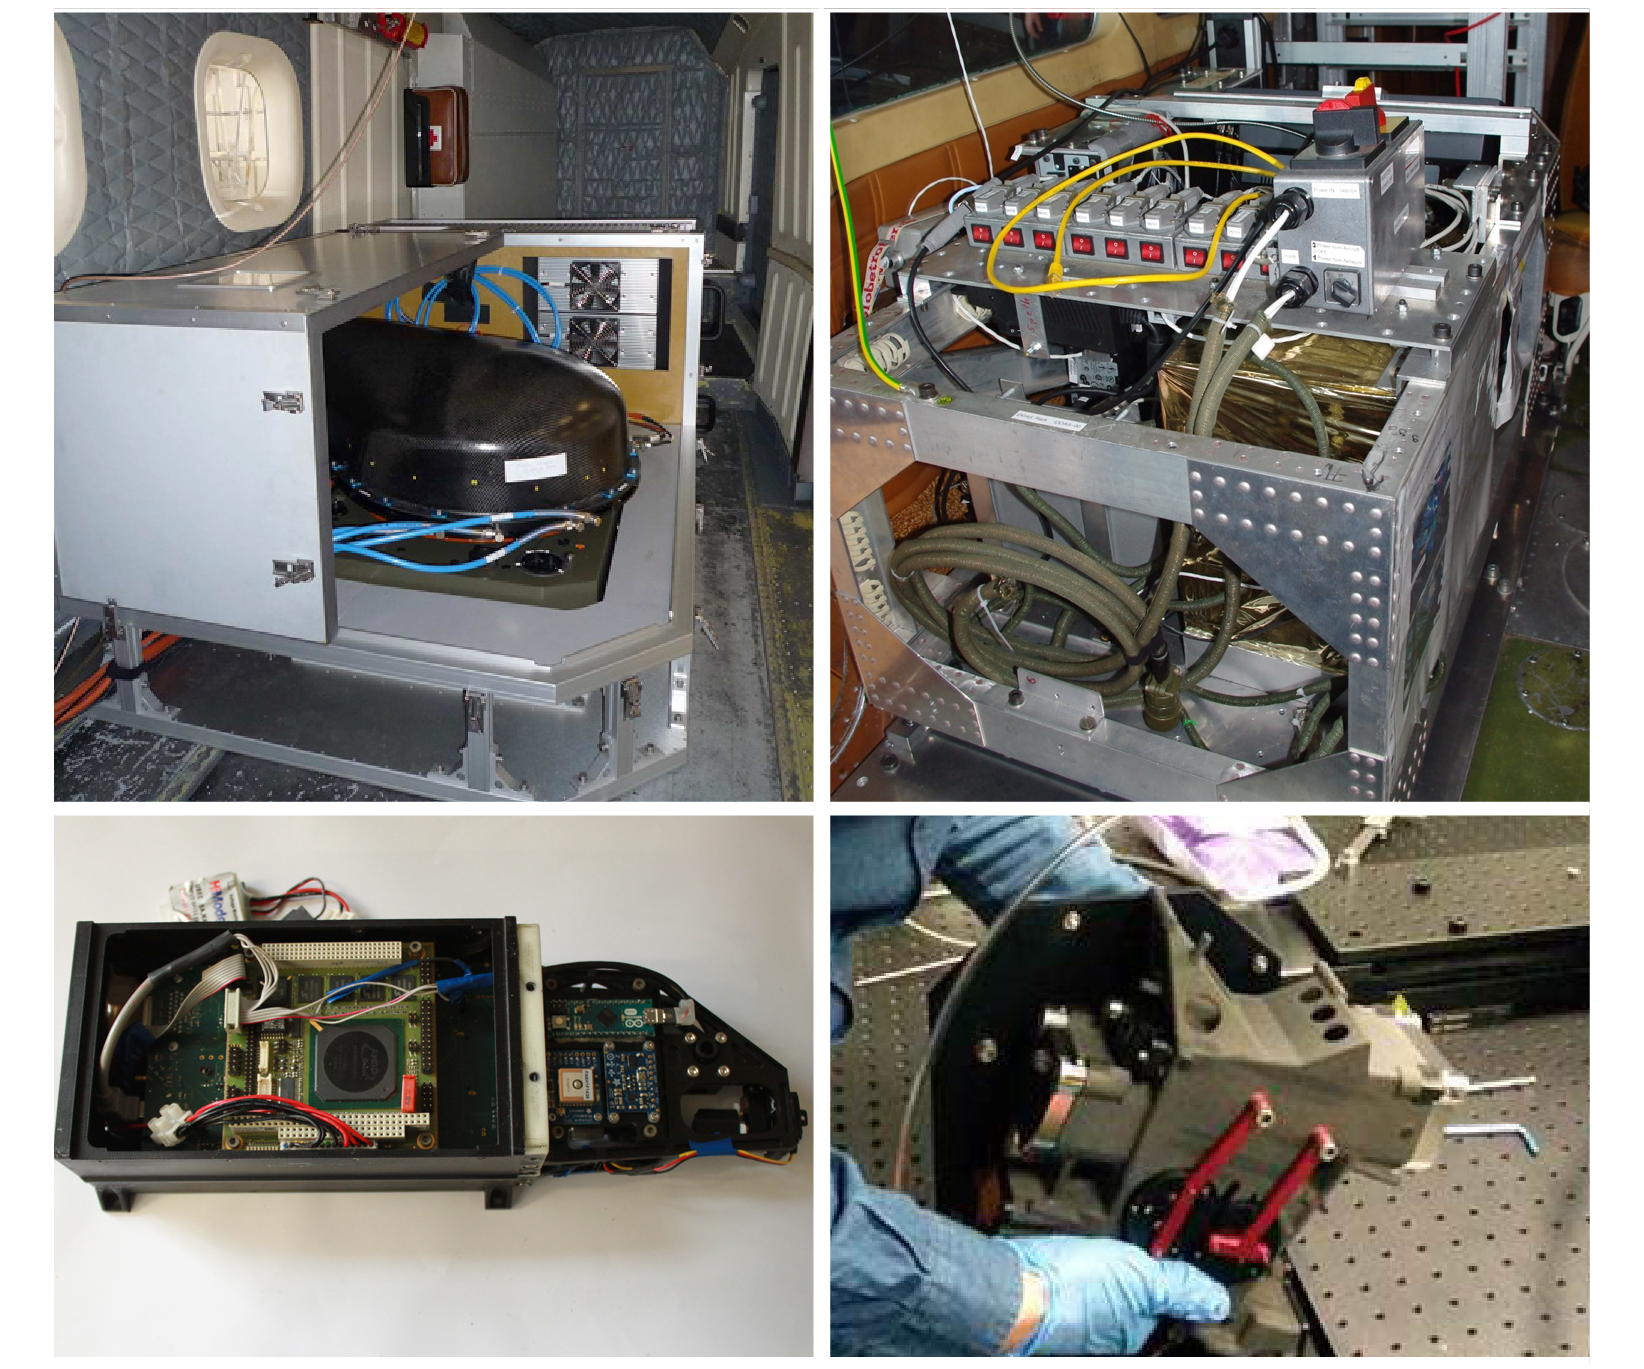
Fig 2. Overview of the four DOAS imaging instruments: APEX (top-left), AirMAP (top-right), SWING (bottom-left) and SBI (bottom-right). NO2 slant columns were retrieved by applying absorption spectroscopy (DOAS) in the visible wavelength region and converted to VCDs by the computation of appropriate air mass factors. Finally, the NO2 VCDs were georeferenced and mapped at high spatial resolution. For the sake of harmonising the different data sets, efforts were done to agree on a common set of parameter settings, AMF LUT and gridding algorithm. The NO2 horizontal distribution, observed by the different DOAS imagers, shows very similar spatial patterns. The NO2 field is dominated by two large plumes related to industrial compounds, crossing the city from west to east. Retrieved NO2 VCDs range between 1 x 10¹⁵ molec cm-2 upwind of the city and 2 x 10¹⁶ molec cm-2 in the dominant plume, with a mean of 7.3 ± 1.8 x 10¹⁵ molec cm-2 for the morning flight and between 1 and 23 x 1015 molec cm-2 with a mean of 6.0 ± 1.4 x 10¹⁵ molec cm-2 for the afternoon flight. The four data sets are in good agreement with Pearson correlation coefficients better than 0.9, while the linear regression analyses shows slopes close to unity and generally small intercepts.
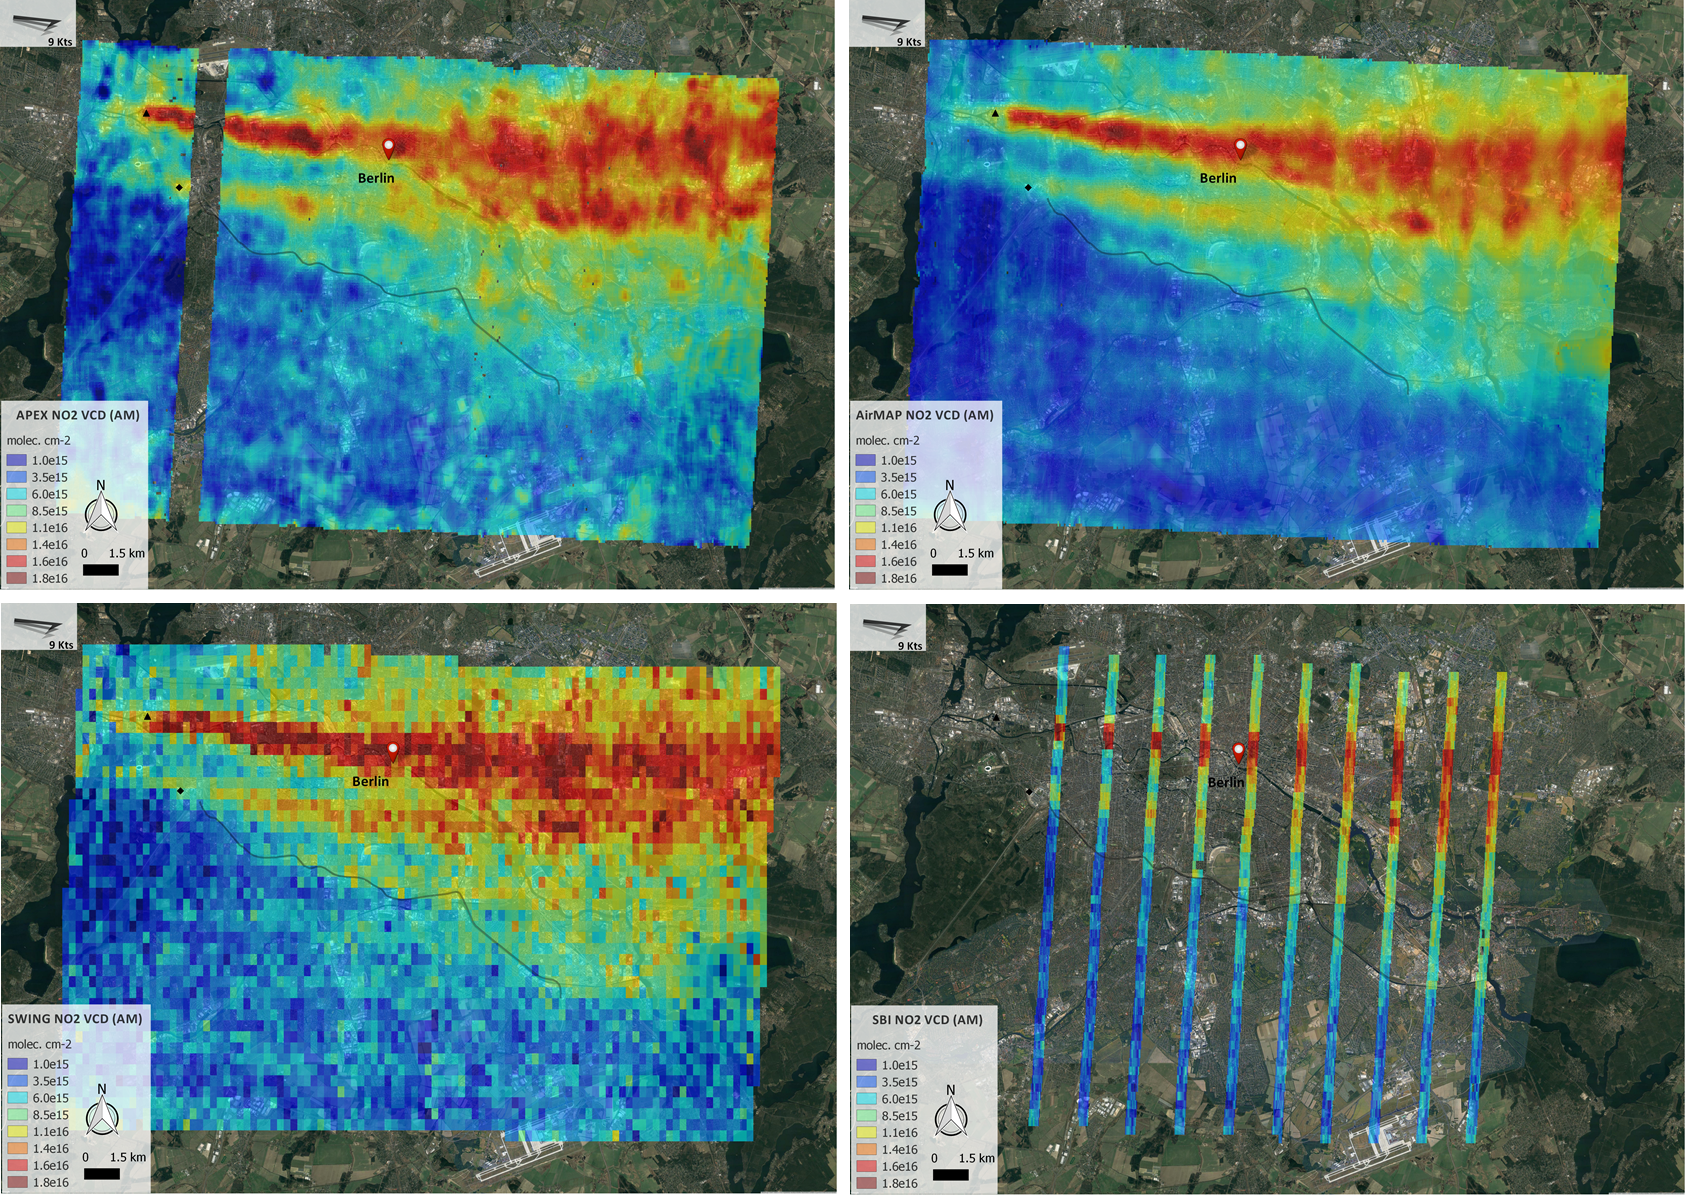
Fig 3. Tropospheric NO2 VCD maps retrieved from (a) APEX, (b) AirMAP, (c) SWING, and (d) SBI for the morning flight over Berlin on 21 April 2016 (Google, TerraMetrics). The key contributing NO2 emission sources are indicated by a black triangle (Reuter West power plant) and black diamond (Messe Berlin). The highways A100 and A113, running south of the city, are marked by the grey line. In parallel with the airborne operations, car-based DOAS systems (MPIC, BIRA-IASB, UGAL) covered Berlin from North to South and West to East. A set of static instruments (including two MAX-DOAS and a ceilometer) were operated continuously from the rooftop of the meteorological institute of the Free University of Berlin, for the period of the campaign. The campaign dataset also includes measurements from the Berlin governmental in-situ network for air quality monitoring.
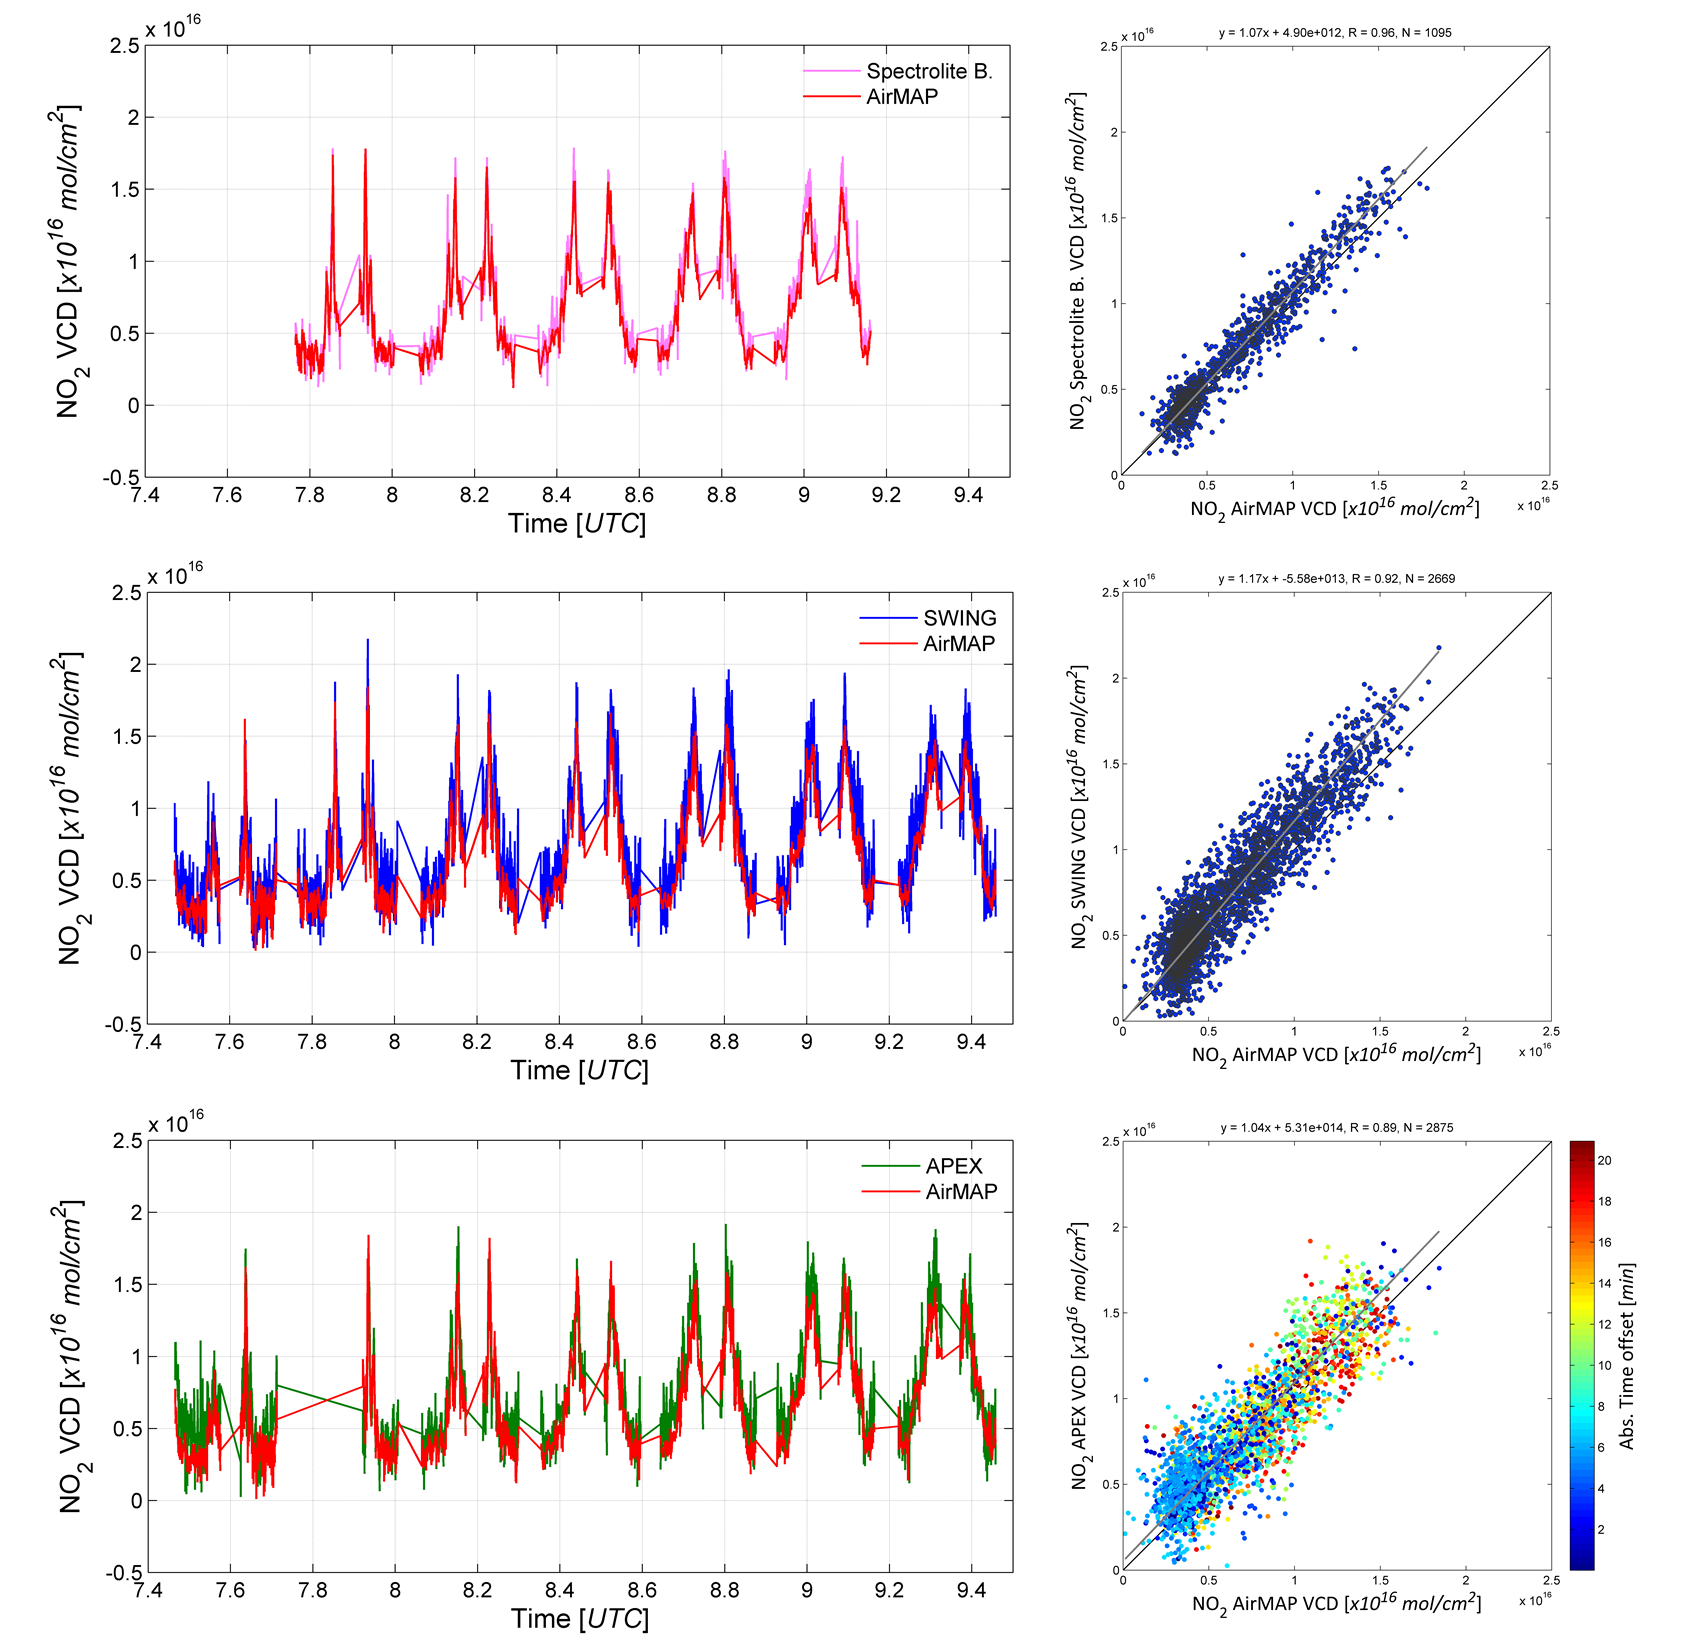
Fig 4. Time series, scatter plots and orthogonal linear regression analyses of co-located NO2 VCDs retrieved from the harmonised maps for the morning flight on 21 April 2016. APEX VCDs are provided in green, AirMAP in red, SWING in blue and SPI in magenta. This study shows that the compared airborne DOAS imagers yield consistent results. The study also demonstrates that the urban NO2 distribution, and its fine scale variability, can be mapped accurately with high spatial resolution and in a relatively short time frame. The observations allow to differentiate local emission sources and reveal the strong horizontal variability of tropospheric NO2 in an urban context, contributing to an increased understanding of trace gas distribution and related chemical processes in urban areas. Publications Tack, F., Merlaud, A., Meier, A. C., Vlemmix, T., Ruhtz, T., Iordache, M.-D., Ge, X., van der Wal, L., Schuettemeyer, D., Ardelean, M., Calcan, A., Constantin, D., Schönhardt, A., Meuleman, K., Richter, A., and Van Roozendael, M.: Intercomparison of four airborne imaging DOAS systems for tropospheric NO2 mapping – the AROMAPEX campaign, Atmos. Meas. Tech., 12, 211-236, 2019, https://doi.org/10.5194/amt-12-211-2019 Acknowledgements and links The scientific teams involved in the project include researchers from Belgium (BIRA, VITO), Germany (DLR, FUB, IUP-Bremen, MPIC), The Netherlands (KNMI, TNO, TU Delft) and Romania (INCAS, UGAL). The AROMAPEX project is supported both by EUFAR through its transnational access scheme and by ESA in the framework of the Copernicus programme and the preparation of the Sentinel missions.
Contact For more information, please contact : Frederik Tack or Alexis Merlaud or Michel Van Roozendael |

Last update on 09 Aug 2019