

|
~ Stations:
|
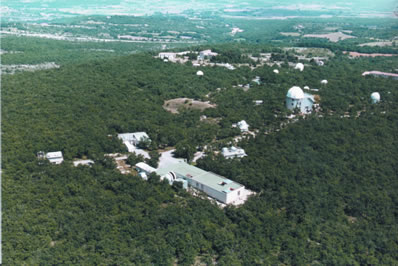
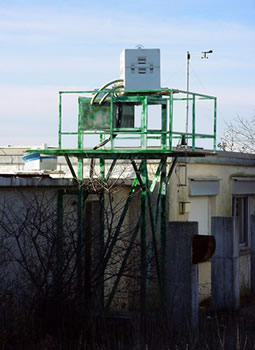
 OHP, France, 43.94°N, 5.71°E Introduction The "Observatoire de Haute-Provence", OHP, Southern France (43.94°N, 5.71°E, 650m asl), is part of the "Observatoire Astronomique de Marseille Provence", OAMP. OHP is one of the primary alpine stations of the international Network for the Detection of Atmospheric Composition Change (NDACC) and is also part of the network of WMO's Global Atmosphere Watch (GAW). The station also reports the stratospheric column amount of ozone and NO2 (stratospheric reference provided by a SAOZ instrument operated by CNRS at OHP since 1992), as well as ancillary data as vertical distribution of pressure/temperature (radio-sondes and temperature LIDAR), ozone (electrochemical ozone sondes, LIDAR, SAOZ and Dobson), and aerosols information (CIMEL instrument operated by Lille University in the AERONET network context), very useful for the MAXDOAS analysis and for the interpretation of the results. Because OHP alternates between background and polluted conditions (essentially due to transport from polluted neighbourhoods), it is a very interesting location for tropospheric observations, providing thus support to validate satellites. Instrument and operation BIRA-IASB has participated to the NDSC/SCUVS-3 intercomparison campaign that held at the Observatoire de Haute Provence for three weeks in June 1996. The purpose of this exercise was to compare NO2 and O3 slant columns from UV-Visible measurements but in parallel to the NDSC activities, BIRA-IASB contributed also with other European groups to the intercomparison of BrO measurements. Even though the site was not appropriate for the detection of this species, it was a good opportunity to discuss about the measurement techniques and to improve the DOAS retrieval algorithms for BrO.
Data BIRA-IASB provides the GEOMON data base (http://www.geomon.eu) with BrO 90°-80° differential slant columns densities measured at OHP. Scientific highlights Bromine monoxide (BrO) is a key atmospheric trace gas known to cause significant ozone destruction in both the stratosphere and troposphere. At OHP, low resolution vertical profiles of BrO have been retrieved by applying a profiling technique to the ground-based MAXDOAS observations performed since 2005. Such a profiling technique enables to separate the tropospheric and stratospheric contributions to the BrO total columns. The retrieved profiles have been used to validate SCIAMACHY limb and nadir measurements. For further details, please, contact Francois Hendrick Moreover, data from the MAXDOAS instrument of OHP are currently used in the O3MSAF framework for the validation of the operational GOME-2A and GOME-2B NO2 product (Lambert et al., 2008; Pinardi et al., 2011; Pinardi et al., 2013). Although it is largely rural, OHP can occasionally be influenced by polluted air masses transported from neighbouring cities, providing interesting test cases for GOME-2 sensitivity to tropospheric NO2. You can find more information in Valks et al., 2011, Pinardi et al., 2011, Pinardi et al., 2013, on the validation webserver for the OHP figures or contact Gaia Pinardi. List of publications Pinardi, G., Lambert, J.-C., Granville, J., Yu, H., De Smedt, I., van Roozendael, M. and Valks, P., "Interim verification report of GOME-2 GDP 4.7 NO2 column data for MetOp-B Operational Readiness Review”, Technical Note / Validation Report for the EUMETSAT O3MSAF (SAF/O3M/IASB/VR/NO2/095/TN-IASB-GOME2B-O3MSAF-NO2-2013), http://o3msaf.fmi.fi/docs/vr/Validation_Report_NTO_OTO_NO2_Jun_2013.pdf , 30 June 2013. . Valks, P., G. Pinardi, A. Richter, J.-C. Lambert, N. Hao, D. Loyola, M. Van Roozendael, and S. Emmadi, Operational total and tropospheric NO2 column retrieval for GOME-2, AMT, 2011, Vol.4, pp. 1491-1514, SRef-ID: amt/2011-4-1491, http://direct.sref.org/amt/2011-4-1491, 2011. Pinardi, G., Lambert, J.-C., Granville, J., Clemer, K., Delcloo, A., Hao, N., and Valks, P., "MetOp-A GOME-2 GDP 4.3 / 4.4 total and tropospheric NO2 validation: 2007-2010", Technical Note / Validation Report for the EUMETSAT O3MSAF, (SAF/O3M/IASB/VR/NO2/095/TN-IASB-GOME2-O3MSAF-NO2-v4-2011), http://o3msaf.fmi.fi/docs/vr/Validation_Report_NTO _OTO_NO2_Feb_2011.pdf, 14 February, 2011. Lambert, J.-C., Pinardi, G., Hao, N., and Valks, P.: GOME-2 GDP 4.2 total NO2 (NTO/OTO) validation update and tropospheric NO2 validation set-up, TN-IASB-GOME2-O3MSAFNO2- 02 ORR-B 1, 24 November, 2008. De Smedt, I., Stavrakou, T., Hendrick, F., Danckaert, T., Vlemmix, T., Pinardi, G., Theys, N., Lerot, C., Gielen, C., Vigouroux, C., Hermans, C., Fayt, C., Veefkind, P., Müller, J.-F., and Van Roozendael, M.: Diurnal, seasonal and long-term variations of global formaldehyde columns inferred from combined OMI and GOME-2 observations, Atmos. Chem. Phys. Discuss., 15, 12241-12300, doi:10.5194/acpd-15-12241-2015, 2015 [link]
|


Last update on 21 Sep 2016